ThingsBoard vs. Grafana: What's Better for IoT?
Content notice: The information in this article was compiled to the best of our knowledge at the time of publication. Technical details, pricing, versions, licensing models and external content are subject to change. Please verify the information independently, especially before making business-critical or security-relevant decisions. This article does not constitute individual professional, legal or tax advice.
When IoT data hits production, teams almost always face the same question: Do we "just" need dashboards and alerting (Grafana) – or an IoT platform with device model, rule engine and workflows (ThingsBoard)?
The short truth: Grafana and ThingsBoard are rarely true alternatives. They solve different parts of the IoT stack – and work best together in many setups.
Below you'll find a clear comparison, typical use cases and a decision guide for production IoT deployments. For that data to arrive in the first place, the sources have to be connected, for example existing Modbus equipment via a converter like the Milesight UC100.
Table of Contents
- 1) What is Grafana?
- 2) What is ThingsBoard?
- 3) The Core Difference in One Sentence
- 4) Comparison by Practical Criteria
- 5) Decision Guide: What Fits When?
- 6) Typical Architecture Examples
- 7) Common Mistakes in Tool Selection
- 8) Conclusion
- Bring Your IoT Project to Life
- References
1) What is Grafana?
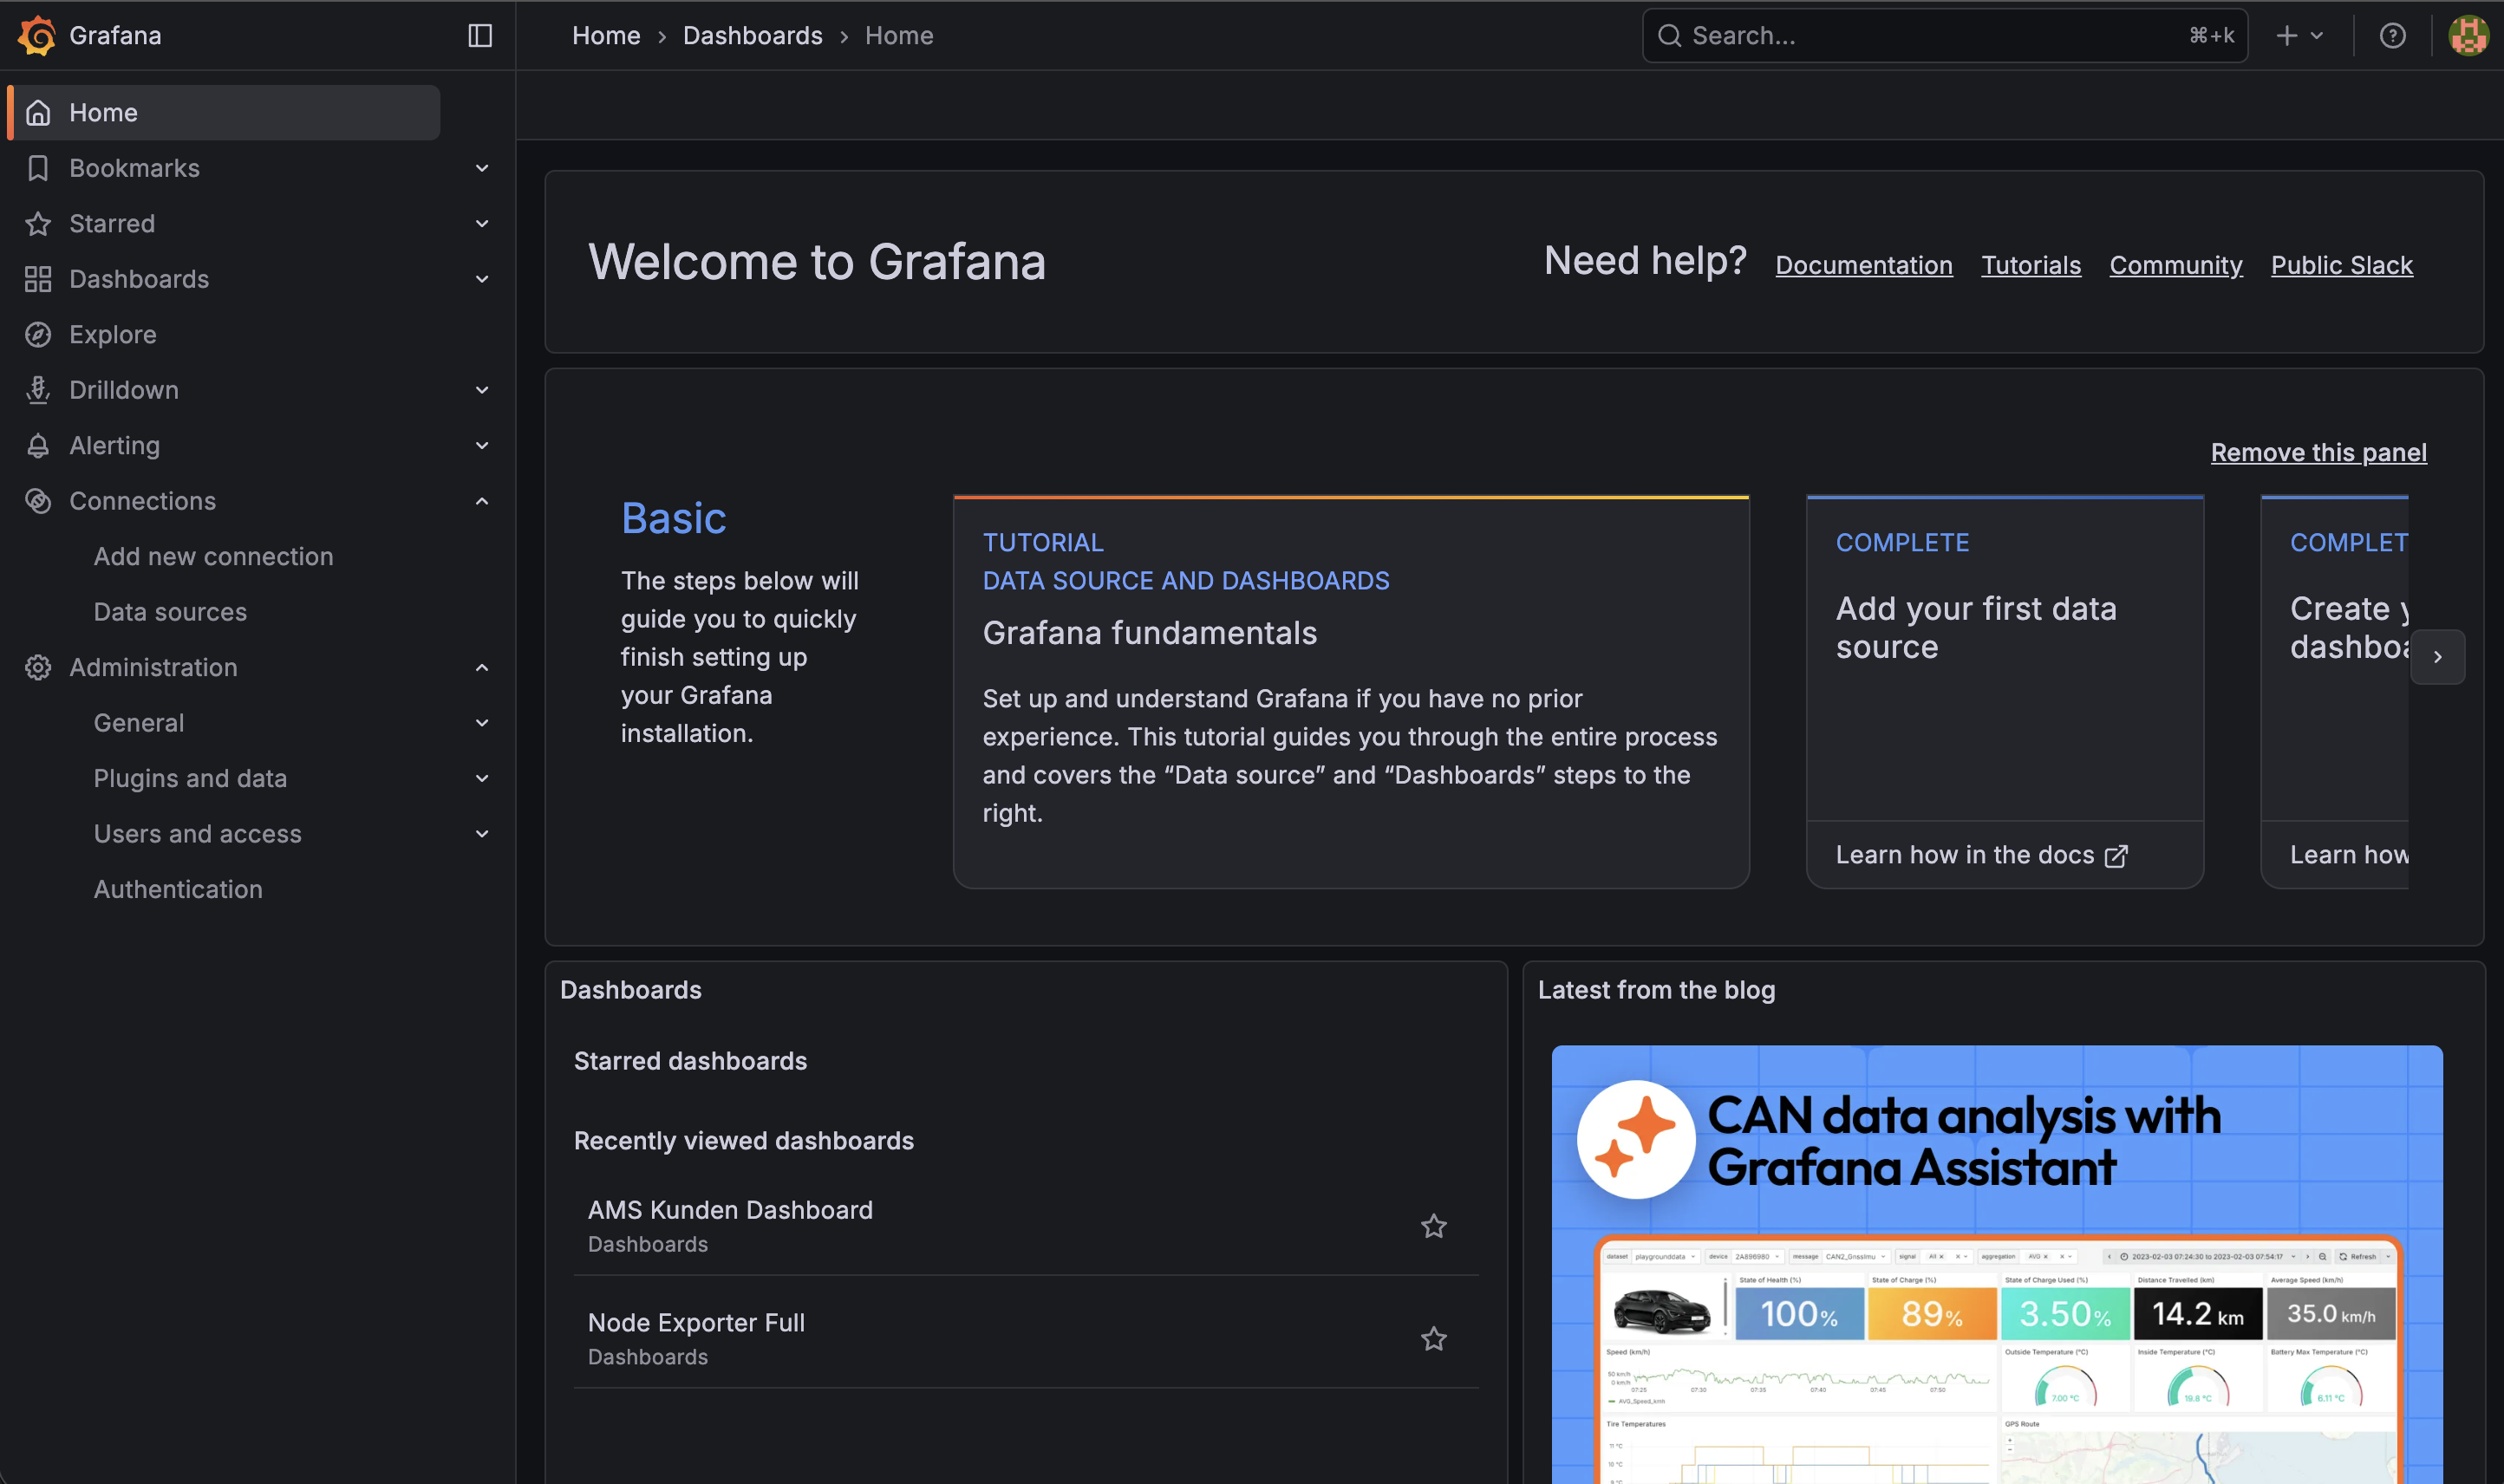
Grafana is primarily a visualization and observability platform: dashboards, queries across data sources, transformations and alerting. Grafana can combine data from many sources in one dashboard (via data source plugins) and offers alerting across multiple data sources including notification routing.
Grafana is strong when you:
- Want to visualize telemetry/metrics (e.g., temperature, CO₂, voltage, gateway health)
- Need reliable alerting (thresholds, state changes)
- Want observability for platform operations (SLO/SLA monitoring)
2) What is ThingsBoard?
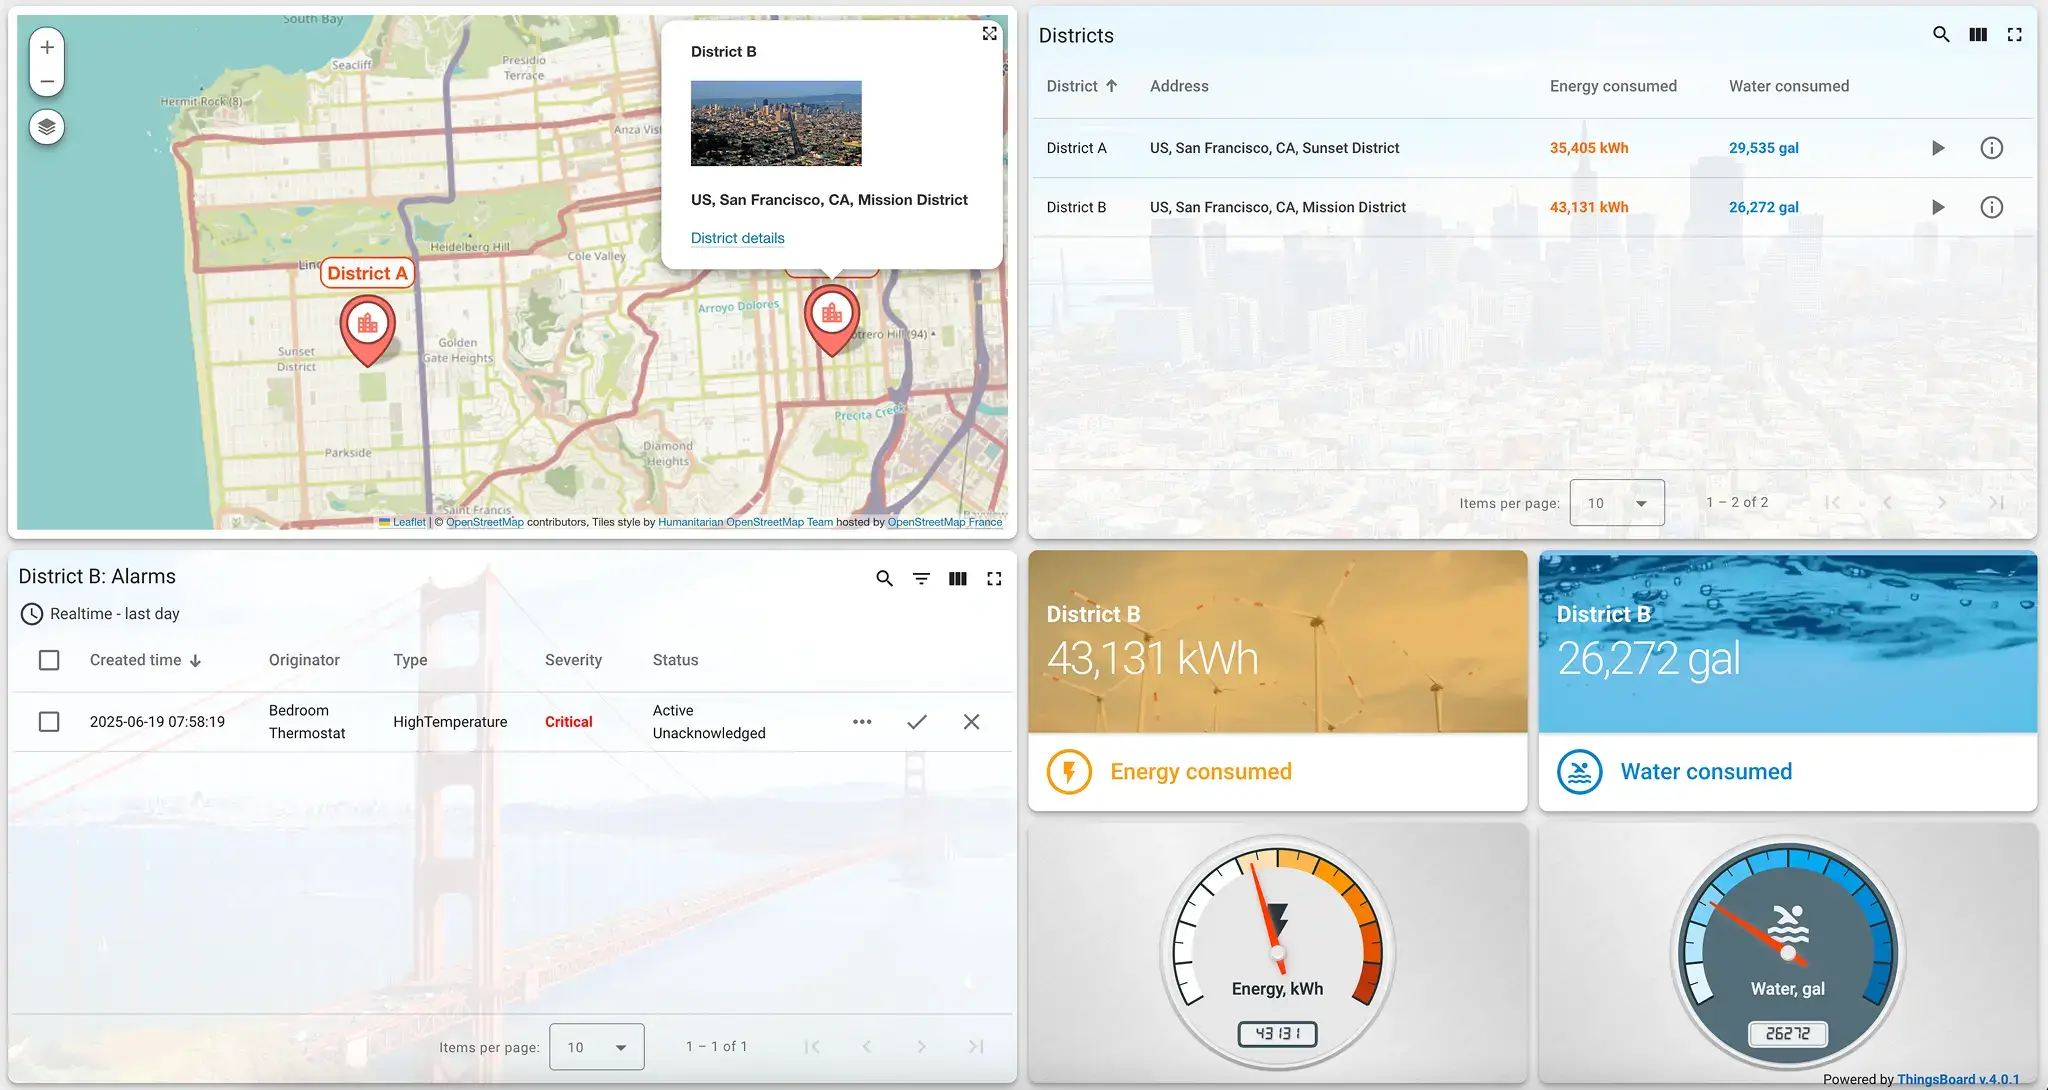
ThingsBoard is an IoT platform focused on device/asset models, data processing and IoT workflows. Central to this is the Rule Engine: It receives telemetry and events, transforms/routes them and reacts accordingly (e.g., trigger alarms, push data to external systems, start workflows).
ThingsBoard is strong when you:
- Want to model devices/assets and their states as platform objects
- Need server-side rules/workflows (Rule Chains, Enrichment, Routing)
- Want to build an IoT application layer with users/roles/entities
3) The Core Difference in One Sentence
- Grafana = "How does the data look, how do we monitor states, how do we alert?"
- ThingsBoard = "How do we model devices/assets, process events, control workflows and build an IoT application?"
4) Comparison by Practical Criteria
A) Device Management & IoT Entities
- ThingsBoard: Device/Asset model is the core of the platform; suitable for multi-device and multi-tenant setups and "IoT app structures".
- Grafana: No native device management; Grafana "knows" data sources and visualizations, but no IoT entities as platform objects.
Rule of thumb: If you need devices as "first-class citizens", ThingsBoard is closer.
B) Dashboards & Visualization
- Grafana: Very strong in dashboards, visualization, data source connectivity and transformations.
- ThingsBoard: Also offers dashboards, but typically as part of an IoT app (with device/asset context and workflows).
Rule of thumb: For classic ops dashboards (SRE/Operations) Grafana often wins; for "app dashboards" per customer/device ThingsBoard is often more suitable.
C) Alerting & Notifications
- Grafana Alerting: Alert rules across multiple data sources, flexible notification policies and routing; based on the Prometheus alerting model.
- ThingsBoard: Can react to events/telemetry – often via Rule Engine/alarms/workflows, so more "IoT application logic" than pure observability.
Rule of thumb: Grafana is very strong for operations alerting; ThingsBoard is suitable when alerts are part of an IoT workflow (e.g., ticketing, device state, escalation logic per tenant).
D) Data Processing / Rules / Workflows
- ThingsBoard: Rule Engine is the heart (transforming, routing, reacting to events/telemetry).
- Grafana: Not a rule engine platform. Grafana is "evaluation/visualization/alerting", not primarily event processing.
Rule of thumb: When "business logic on events" is important, ThingsBoard leads.
E) Production Operations (Ops Effort)
Both systems are good, but: They are often underestimated when it comes to upgrades, backups, tenants, monitoring, scaling and ownership.
- Grafana (prod): Data sources, alerting, provisioning/config-as-code, RBAC/users, backup strategies.
- ThingsBoard (prod): Platform operations including data processing pipeline, rule chains, device/entity models, permissions/tenants, integrations.
Rule of thumb: ThingsBoard is more "Platform Ops", Grafana is more "Observability Ops".
5) Decision Guide: What Fits When?
You need Grafana when …
- you quickly need IoT dashboards and ops monitoring
- data is cleanly in a TSDB/monitoring pipeline (e.g., Prometheus/Influx)
- alerting across multiple data sources and clean routing should be central
You need ThingsBoard when …
- you want to model devices/assets (customers/tenants, roles, entities)
- you need Rule Engine / Workflows in the IoT backend
- you want to build an IoT application layer (not just monitoring)
You need both when …
- ThingsBoard provides the IoT application logic (Rules, Device Model)
- Grafana handles operations monitoring and possibly SRE alerting
6) Typical Architecture Examples
Example A: LoRaWAN (ChirpStack) → Grafana (Ops Dashboard)
Sensors/Gateways → ChirpStack → Data Pipeline/TSDB → Grafana Dashboards & Alerting
Suitable for:
- Cold storage/temperature monitoring
- Environmental monitoring
- Infrastructure monitoring
Example B: LoRaWAN (ChirpStack) → ThingsBoard (IoT App)
Sensors/Gateways → ChirpStack → MQTT/Integration → ThingsBoard (Rule Engine, Entities, Workflows)
Suitable for:
- Multi-tenant solutions
- Customer portals / device portals
- Complex business workflows
Example C: Combo: ThingsBoard (App) + Grafana (Ops)
ThingsBoard for device/tenant logic, Grafana for platform monitoring, SLOs, alerting, operations.
Suitable for:
- Larger rollouts
- Teams with clear separation "Product" vs "Operations"
7) Common Mistakes in Tool Selection
-
Treating Grafana as an "IoT platform" – Grafana is excellent for dashboards/alerting, but not a device management backend.
-
Using ThingsBoard only as a dashboard tool – Then the biggest value (Rule Engine/IoT workflows) remains unused.
-
Underestimating operations – The first dashboards are quick. Scaling, updates, backups, monitoring and ownership are the real cost drivers.
8) Conclusion
Grafana is your best choice when you want to reliably visualize and alert on IoT data.
ThingsBoard is your best choice when you need an IoT application layer with device model and rule engine.
In many production environments they complement each other: ThingsBoard for IoT logic, Grafana for ops observability.
Bring Your IoT Project to Life
Have an idea for connected sensors? merkaio guides you from requirements analysis to ongoing operations – technology selection, architecture, implementation, and operations.
References

Written by
Timo Wevelsiep
Co-Founder
Co-Founder of merkaio. Building IoT infrastructure and managed operations. Focused on LoRaWAN, open-source IoT platforms and scalable sensor deployments.
LinkedInReady to build your IoT project?
From idea to production - we guide your IoT journey.